Richard Tribess

M.Sc. Richard Tribess
Suspension Droplet Wall Collision and Particle Deposition (SO 204/55-1)
Introduction
The impact process of suspension droplets is present in many industrial applications. The droplet impact outcome depends on operational conditions, such as liquid and gas composition, substrate properties and properties of the solid dispersed phase. Particle dynamics during the impact process are influenced by particle-particle, particle-substrate and particle-interface interactions. For aqueous suspensions and solid particles with equally charged surfaces, short-range repulsive interactions can prevent particles from sticking together or depositing at the substrate, described by the DLVO theory. Such complex interactions play an important role in the particle deposition pattern at the substrate during the impact process. Figure 1 shows the spreading phase of the impact process of a water droplet in air, with a small concentration of 10μm neutrally buoyant polystyrene particles. Several particle aggregates/agglomerates can be observed, as well as the particle dispersion within the droplet. The images were obtained using a high-speed imaging technique (Schubert et al., 2024; Vogelsang et al., 2025) in a cooperative work with the Institute of Aerospace Thermodynamics (ITLR) of the University of Stuttgart (Tribess et al., 2025).
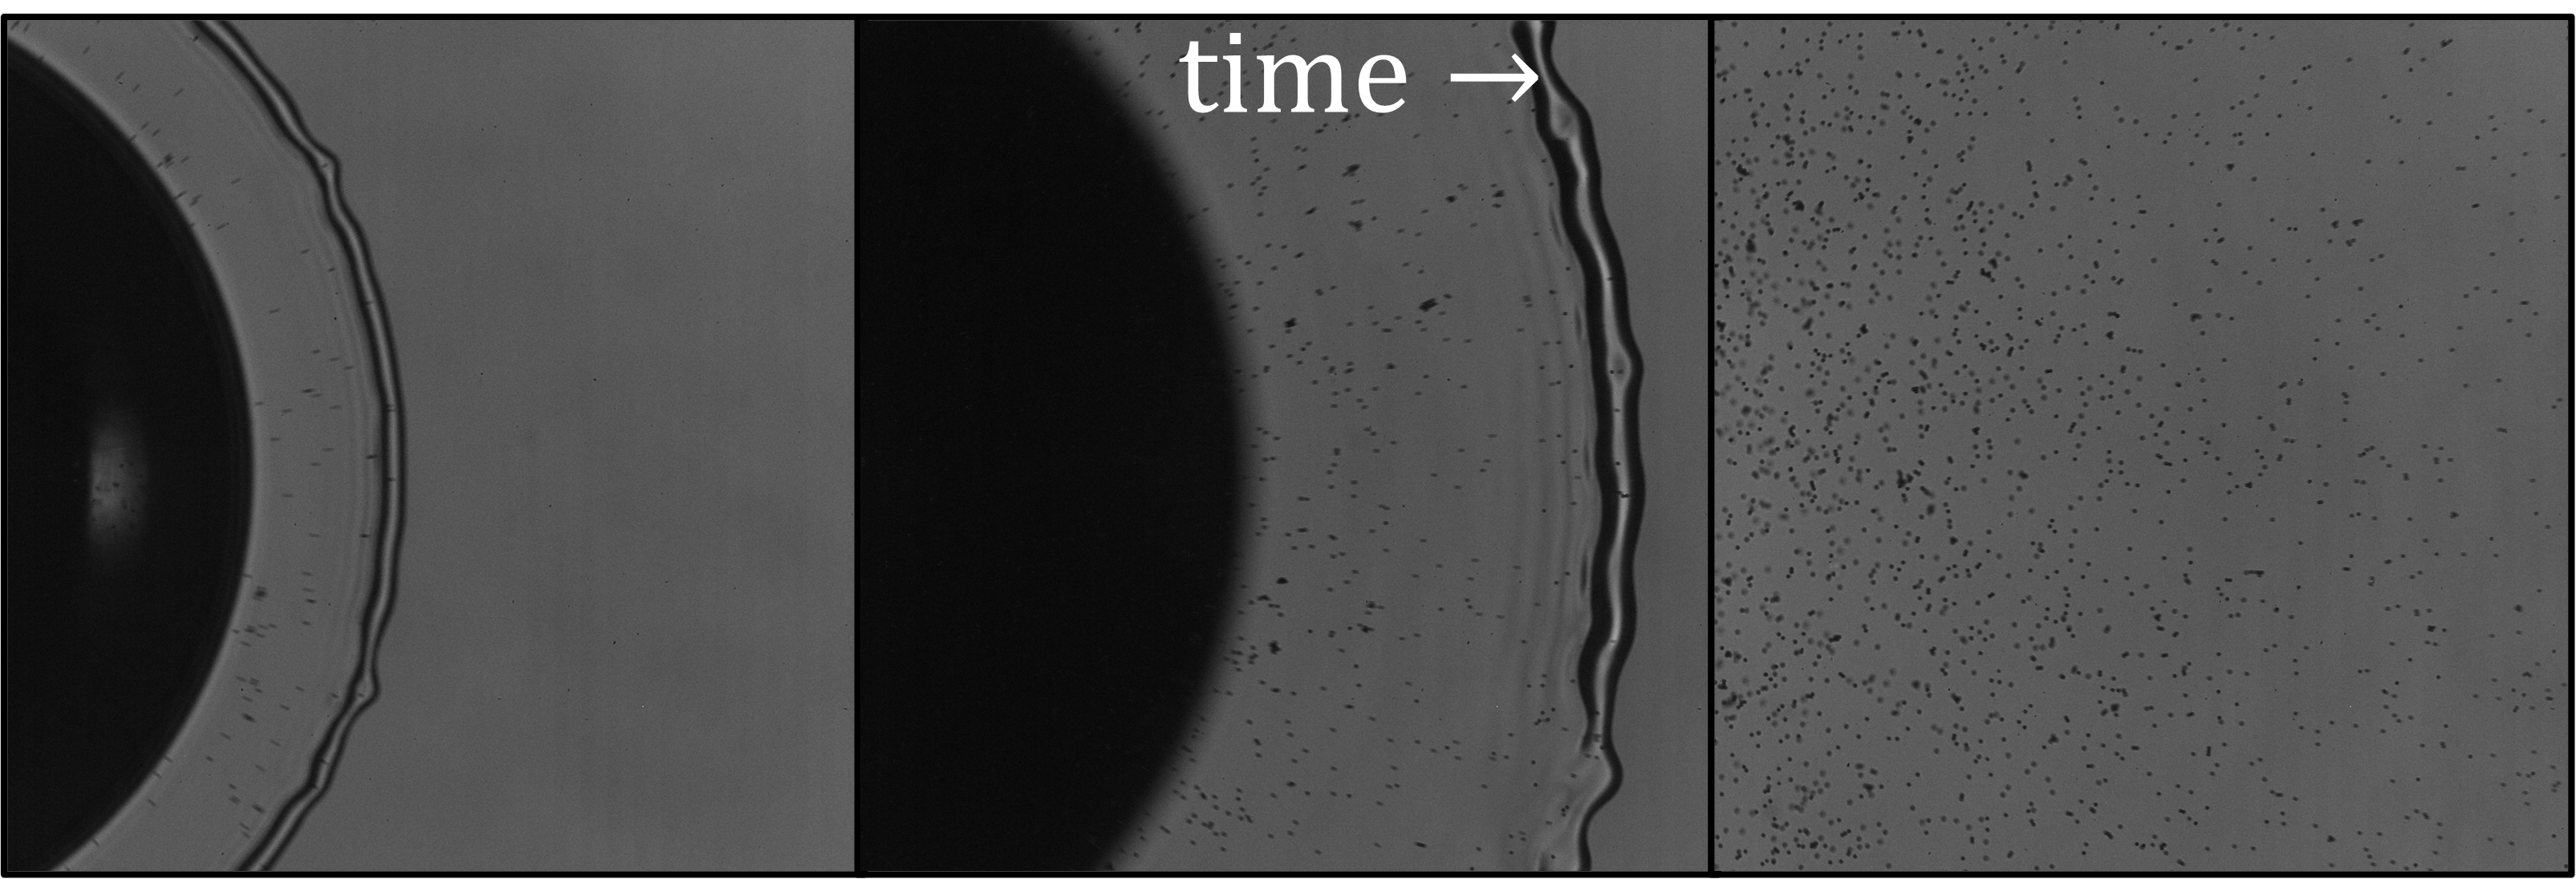
Figure 1: Spreading phase of a water droplet in air with a small volume fraction of polystyrene particles.
Experimental analysis of particle dynamics during the impact process of suspension droplets is difficult. Techniques such as μPIV and μPTV have been successfully employed on the tracking of micrometer-sized particles and the determination of their radial velocity during the impact of suspension droplets onto liquid films (Schubert et al., 2024; Vogelsang et al., 2025), relying on high-speed imaging of the impact bottom microscopic view where high image spatial resolution is required. When combining a μPTV with a defocusing technique calibrated for the liquid-solid particle-substrate material combination, it is possible to obtain a 3D particle position profile for particles tracked within a limited range from the microscopic view focal plane.
Computational Fluid Dynamics (CFD) can be used as an alternative to obtain critical information about particle-particle, particle-substrate and particle-interface interactions during the impact process of suspension droplets. The main advantage of numerical simulations when compared with experiments is the easier reproducibility, related to the control of operational conditions, such as the initial droplet shape and velocity as well as particle concentration, size, and distribution within the liquid droplet. Another important aspect is that numerical simulations are not limited to the experimentally measured region, providing information about particle dynamics within the whole droplet. Experiments are also limited to the recorded region that usually does not fit the whole droplet spreading. An efficient and precise numerical approach can provide useful insight on particle behavior during the impact process, once validated regarding the droplet impact morphology and discrete phase dynamics.
Project Description
The main objective of this project is to develop a predictive CFD tool for the analysis of the impact process of suspension droplets using the OpenFOAM® C++ toolbox. Relevant droplet-substrate, fluid-particle, particle-particle and particle-substrate interactions are modeled.
Mathematical Modeling
In the proposed approach, liquid droplets are resolved with an interface capturing geometric Volume of Fluid (VOF) method based on the TwoPhaseFlow OpenFOAM® library, using the isoAdvector advection scheme, the RDF curvature method and the plicRDF reconstruction scheme. Contact angle hysteresis is considered with a dynamic contact angle pinning model. Spurious currents reduction techniques are employed, as well as a mixed boundary condition for the velocity to avoid a singularity at the Three-Phase-Contact line (TCL) region. A detailed description of the liquid droplet modeling can be found in Tribess and Sommerfeld (2026).
Point-particles are tracked using a Lagrangian Particle Tracking (LPT) algorithm. The linear and angular velocities of each particle are calculated according to fluid-particle interaction forces, such as the drag force for spherical particles; the slip shear and rotational lift forces for spherical particles; the pressure gradient and added mass force; a capillary force based on the penetration angle between the particle center of mass and an interface segment (Tribess et al., 2025) – used to model particle-interface interactions, described in Figure 2. The gravity + buoyancy body force is also accounted for.

Figure 2: Particle-interface capillary force scheme.
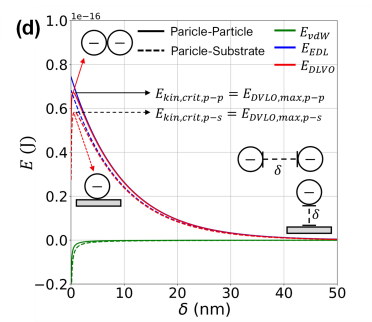
Particle-particle collisions are tracked using a deterministic approach and solved using a hard-sphere model with possible agglomeration (Breuer and Almohammed, 2015), ignoring cohesive impulses, as shown in Figure 3 (a), (b). Particle-substrate interactions are also modelled using a hard-sphere approach with possible deposition at the substrate. Agglomeration and deposition events are modelled using the DLVO theory, where depending on the surface potential of solid particles and the substrate, a competition between the attractive Van der Waals (VDW) and the repulsive Electrostatic Double Layer (EDL) energies can occur. Figure 3 (d) displays the energy barrier diagram obtained for polystyrene particles in a water droplet impacting a sapphire glass substrate. Particles can either agglomerate upon a particle-particle collision event or deposit at the substrate during a particle-substrate collision event if the particle kinetic energy based on the particles relative velocities (for particle-particle collisions) or on the particle velocity normal to the substrate (for particle-substrate collisions) overcomes the DLVO energy barrier EDLVO=EVDW+EEDL (Tribess et al., 2025). The breakage of agglomerates is not modeled and formed agglomerates are assumed as a volume equivalent sphere calculated based on the properties of the original particles involved in the particle-particle collision event – shown in Figure 3 (c). Particles that deposit at the substrate can either stick to it permanently or be resuspended by the droplet internal flow according to a balance between hydrodynamic forces (drag, slip shear lift and the particle-interface capillary force and the adhesive VDW force + the particle weight).

 |
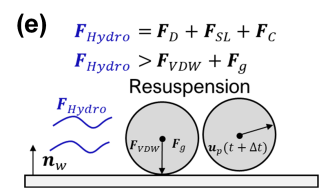 |
Figure 3: (a) Deterministic particle-particle collision detection; (b) Collision detection and hard-sphere parameters; (c) Volume equivalent sphere agglomerate; (d)Typical DLVO energy barrier for agglomeration and deposition for polystyrene particles in a water droplet; (e) Resuspension model based on the competition between hydrodynamic forces and the VDW adhesive force.
The feedback from the point-particles to the fluid flow is given with a two-way coupling approach. In typical VOF-LPT simulations, the particle-to-cell size ratio is close to or larger than one. With such conditions, large errors can occur when the fluid-particle momentum coupling is made (Evrard et al., 2021). For this reason, the distribution of the source term to cells found within a kernel support radius is made using a Gaussian filter. To reduce errors due to the particle induced disturbance on the fluid velocity on the prediction of fluid-particle interaction forces, the fluid properties are interpolated at points generated at the surface of each particle instead of being sampled at the particle center of mass position.
Selected Results
Results obtained in Tribess et al. (2025) are displayed. The impact process of water suspension droplets with a low concentration of polystyrene particles with dp=10 μm was analyzed for different droplet sizes (D0) and velocities (U0) , obtaining We=ρU02D0σ=234.77 and 409.18 (where ρ is the liquid density and σ the gas-liquid surface tension coefficient). The effect of the particle volume fraction αp on the droplet impact morphology was analyzed for αp=0.25% and 1.00% . The results are compared with experimental results obtained with high-speed imaging and the μPTV technique described in Vogelsang et al. (2025). Figures 4 (a) and (b) show the spreading factor for the different analyzed impact conditions and particle volume fractions. Nearly no influence of the particle volume fraction is observed on the spread factor evolution. A comparison between numerical and experimental results for We=234.77 and αp=0.25% for the top inclined view, showing the deposition impact outcome. Ripples near the TCL are observed in both experimental and numerical results, forming a thicker liquid film near this region.
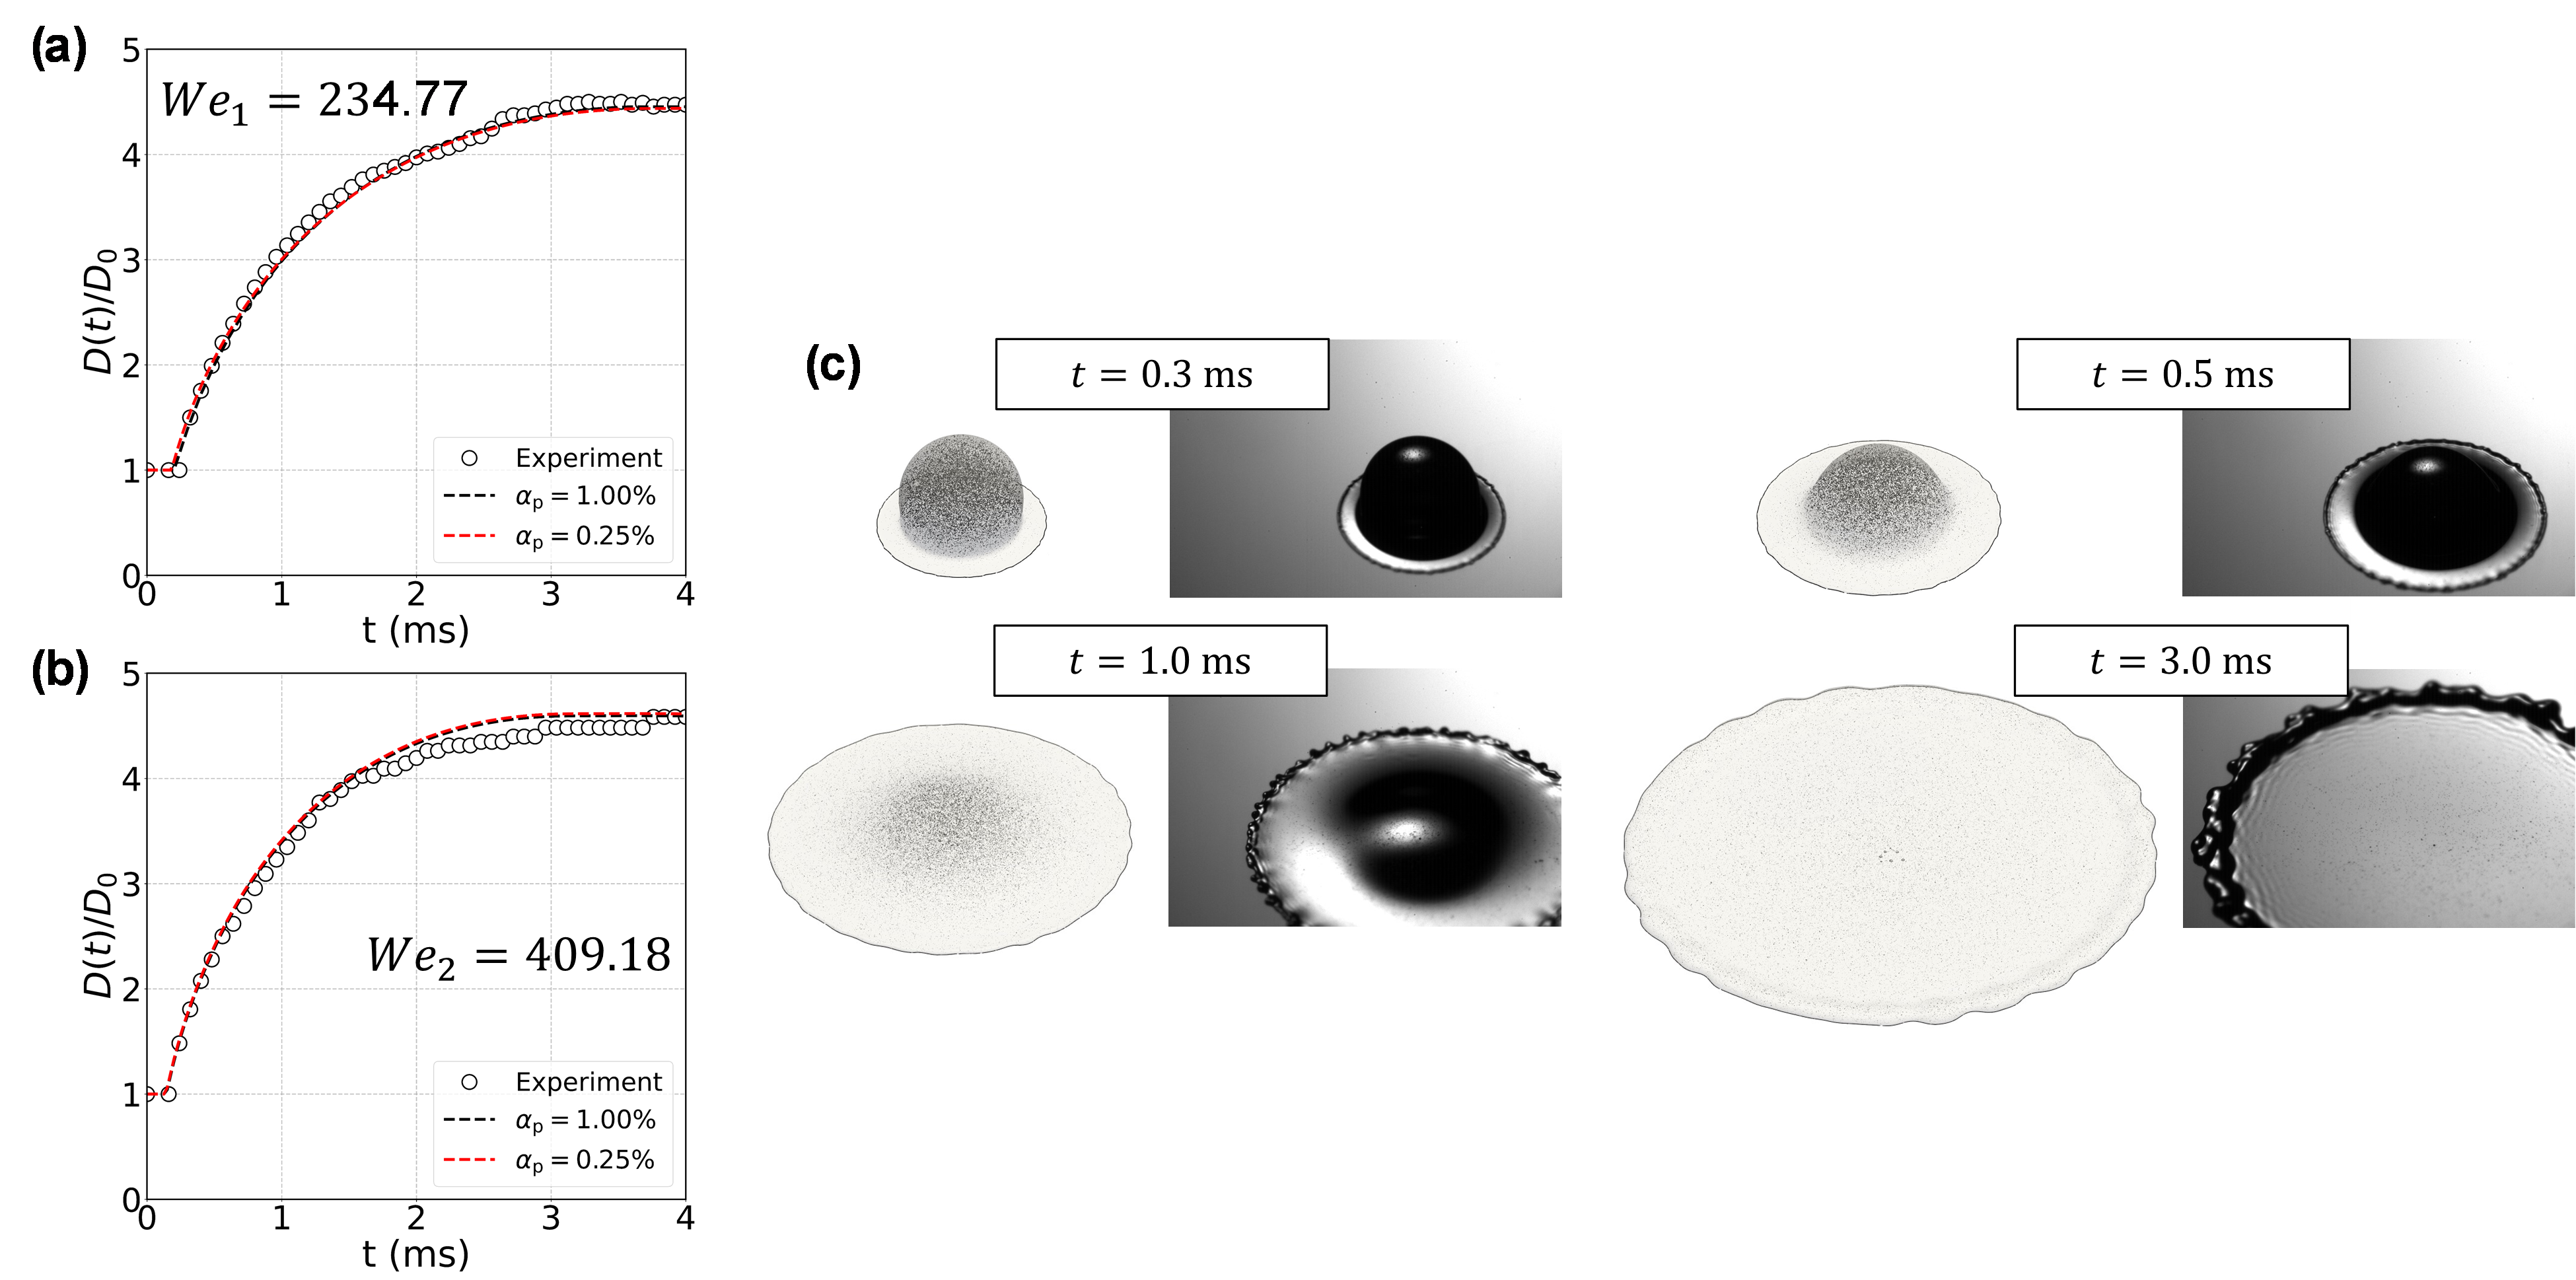
Figure 4: (a) Spread factor evolution for We=234.77 ; (b) Spread factor evolution for We=409.18 ; (c) Qualitative comparison for the droplet impact morphology for We=234.77 .
Figure 5 shows a comparison between numerical and experimental results for the microscopic bottom view of the impact for We=234.77 and αp=0.25% . A good agreement for the spreading front is observed when comparing the results. As expected, the liquid velocity profile is radially symmetrical, and the small particles with a small particle Stokes number follow the streamlines. Particle clusters/agglomerates are observed in both experimental and numerical results. More agglomerates occur in the experimental results, since particles naturally agglomerate during the suspension droplet production process, before it detaches from the needle used to drop it onto the substrate, while in the numerical simulations, a mono-sized particle distribution is injected into the droplet, and agglomeration only takes place during the impact process.

Figure 5: Comparison of the microscopic bottom view between (a) Experimental and (b) Numerical results for We=234.77 .
Good quantitative and qualitative agreement is found between the numerical and experimental results. Next, number-based particle agglomeration rates in and number and mass-based particle deposition rates are plotted for the analyzed conditions in Figures 6 (a) and (b), respectively.
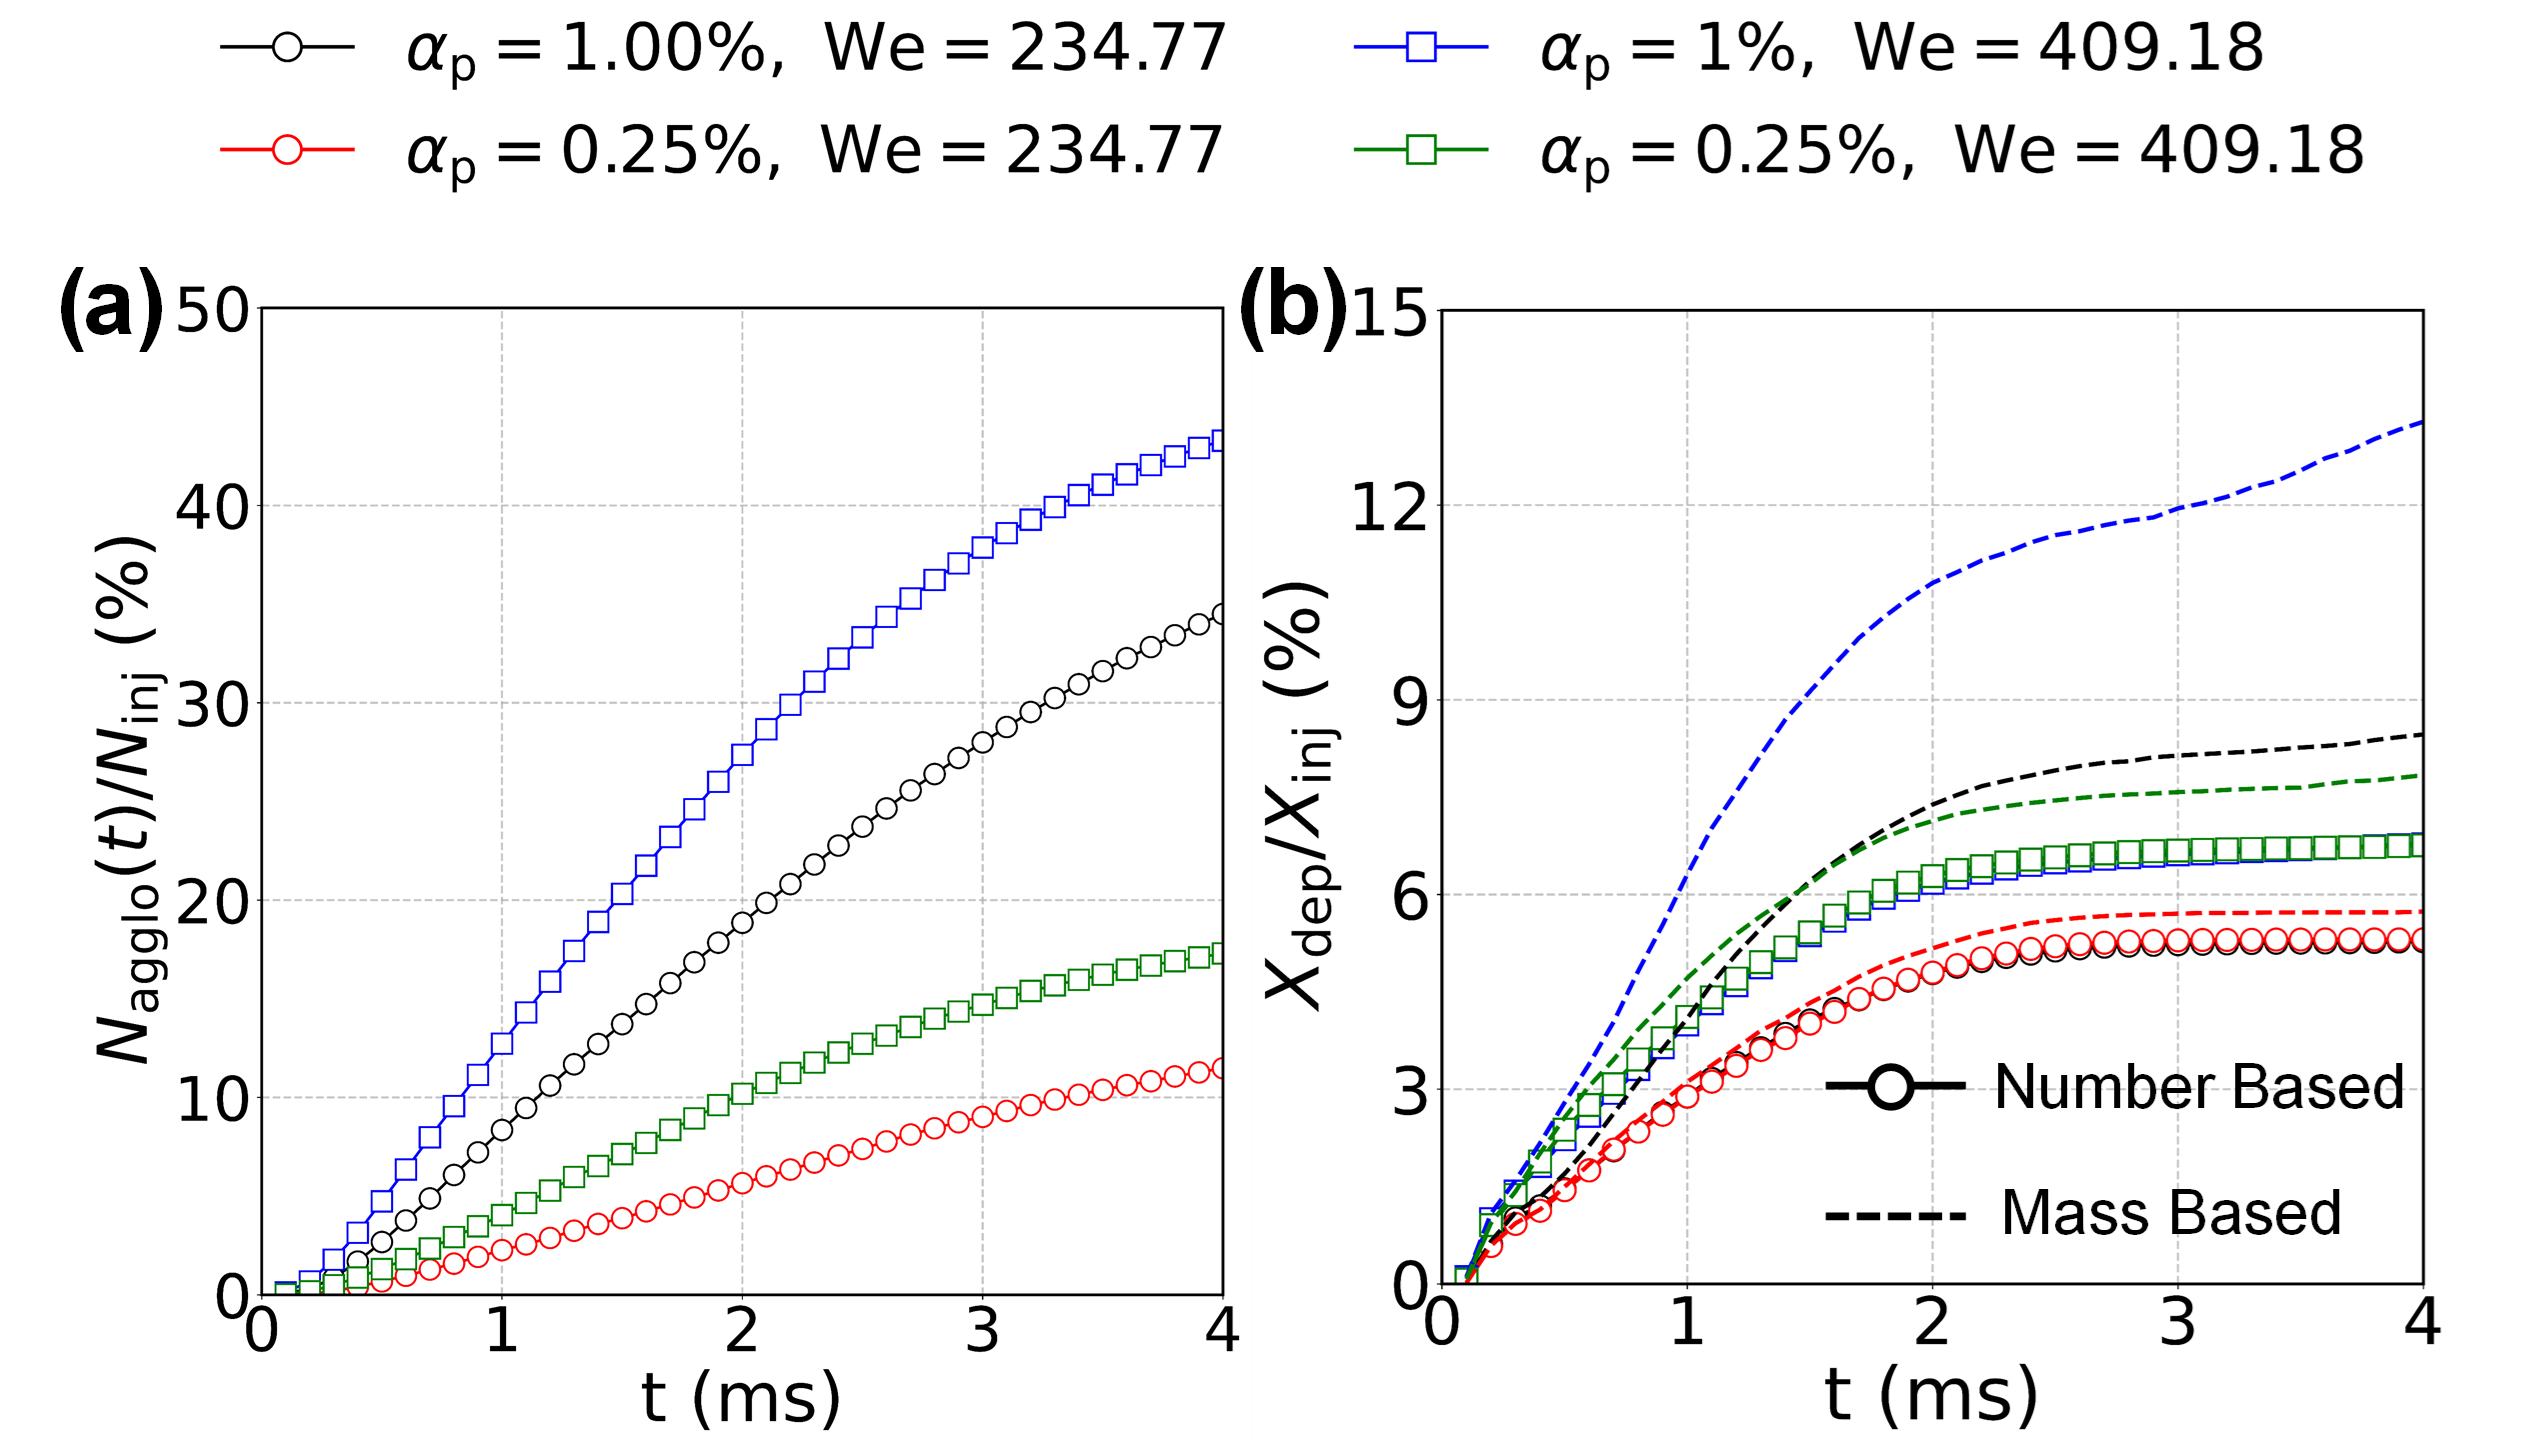
Figure 6: (a) Number based particle agglomeration rates; (b) Number and mass-based particle deposition rates; for different We and αp .
Larger particle volume fractions yield on larger agglomeration rates, since a larger overall number of particle-particle collisions occur for larger particle concentrations. For the same particle volume fraction, increasing the droplet impact velocity promotes a larger number of high kinetic energy particle-particle collisions, also increasing particle agglomeration rates. Number based deposition rates are not influenced by the droplet impact velocity; however, a considerable increase is observed when increasing the droplet impact velocity. In contrast, mass-based particle deposition rates are increased for the same impact velocity and larger particle concentrations due to a larger amount of particle-particle agglomeration that occur for more concentrated suspensions. In Figure 7, particle deposition profiles are plotted with the position and time of every deposition event for We=234.77 and αp=0.25% . In Figure 7 (a), a basic particle deposition model is considered, where all particles that overcome the DLVO energy barrier are deposited at the substrate and removed from the simulation. Figure 7 (b) considers the previously mentioned particle resuspension model based on the competition between hydrodynamic and adhesive forces, with circular markers for particle deposition events where the particle stays deposited at the substrate and star markers for resuspension events.
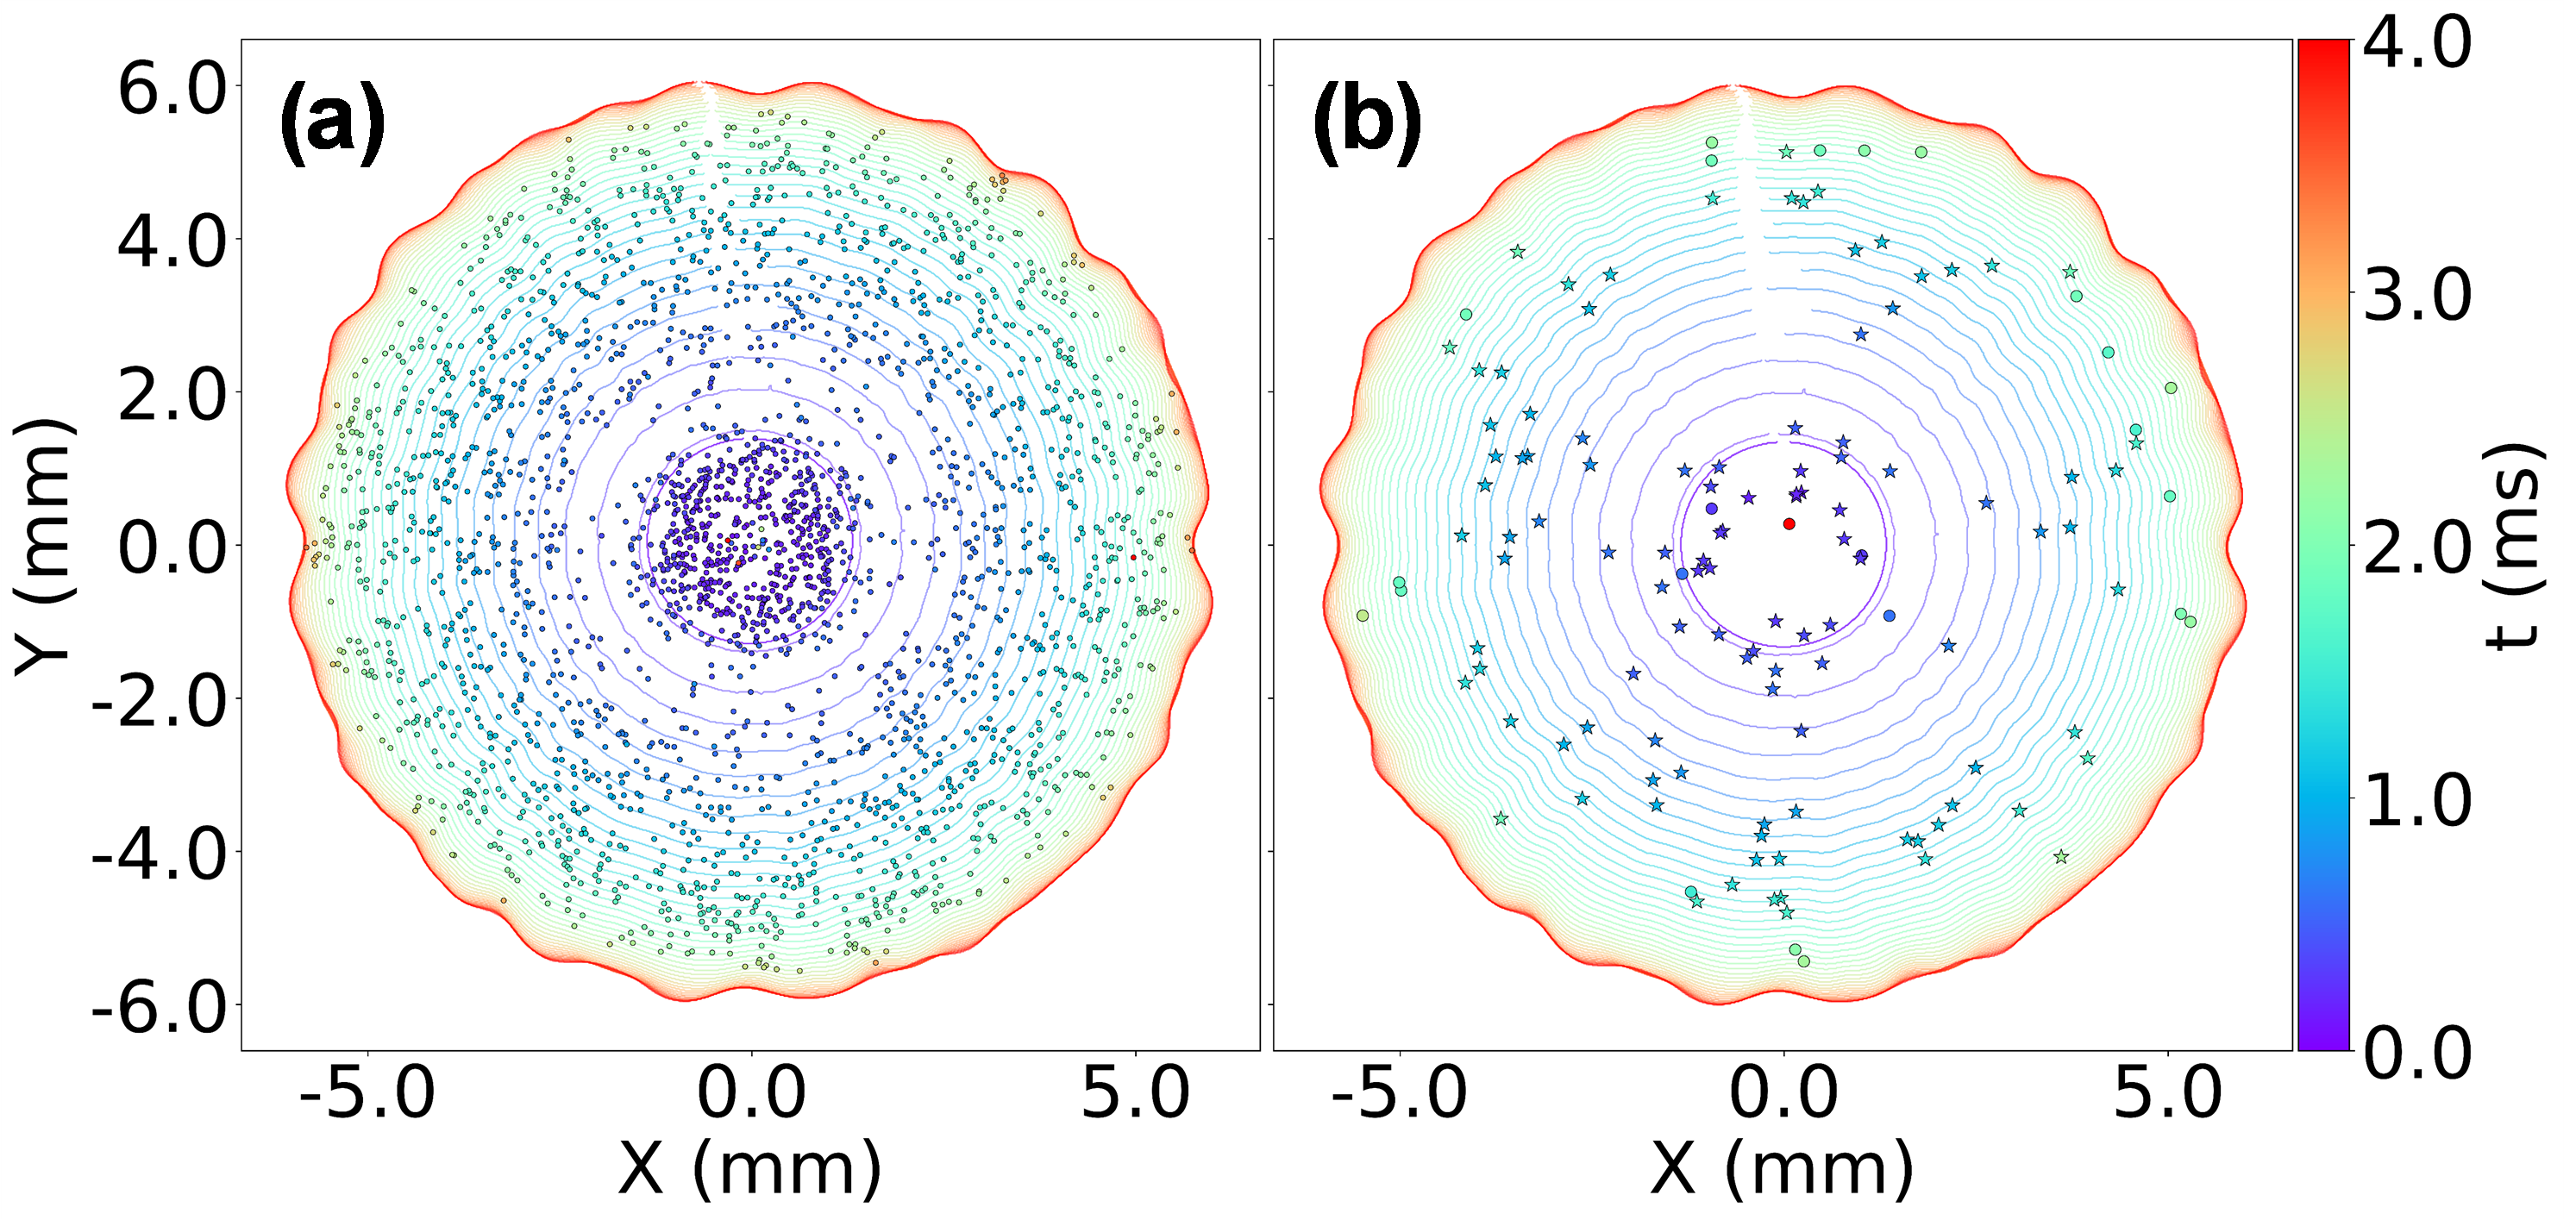
Figure 7: Particle deposition pattern for We=234.77 and αp=0.25% for (a) Basic deposition model; (b) Accounting for resuspension due to hydrodynamic forces.
The total number of particles deposited at the substrate reduces drastically when considering particle resuspension, from Np,dep,final=2594 when using the basic model that only checks if the particle kinetic energy overcomes the DLVO energy barrier, to Np,dep,final=25 when considering particle resuspension. Lastly, in Figure 8, the μPTV technique described in Vogelsang et al. (2025) is used to track particles recorded with the high-speed imaging technique described in Tribess et al. (2025) for the impact condition with We=234.77 . Particle radial velocity profiles are plotted as a function of particle (x,y) coordinates for different times during the spreading of the droplet, recorded with the microscopic bottom view of the impact. The experimental results, plotted as the large markers with respect to time, are compared with results obtained from the numerical simulations using the described VOF-LPT approach considering the particle resuspension model for αp=0.25% . Every particle tracked in the numerical simulations is plotted as a small marker, also colored with respect to time. The numerical results are plotted for a height interval in between z=0 μm and z=200 μm . A good match between experimental and numerical results is observed for the maximum particle velocity across all plotted time values. Nearly linear behavior for the radial velocity is observed for the initial time of 1.2 ms for the whole measurement region. As time passes, the linear behavior holds up until a smaller radial position, as seen for 2.9 ms. In a solid-liquid-solid medium, lubrication forces are expected to have a large influence upon the particle-particle and particle-substrate collisions. Such forces are neglected in the current project due to the complexity of implementation for point-particle simulations. For this reason, particles may lose a considerable amount of momentum due particle-substrate collisions in the numerical simulations, as can be observed in Figure 8 (green, yellow, and purple numerical results markers are found with a much smaller velocity all throughout the analyzed radial sections, indicating large momentum loss due to particle-wall collisions neglecting lubrication effects). In reality, particle-substrate lubrication may induce strong stresses on the small solid particles, completely preventing particle-substrate collision events.
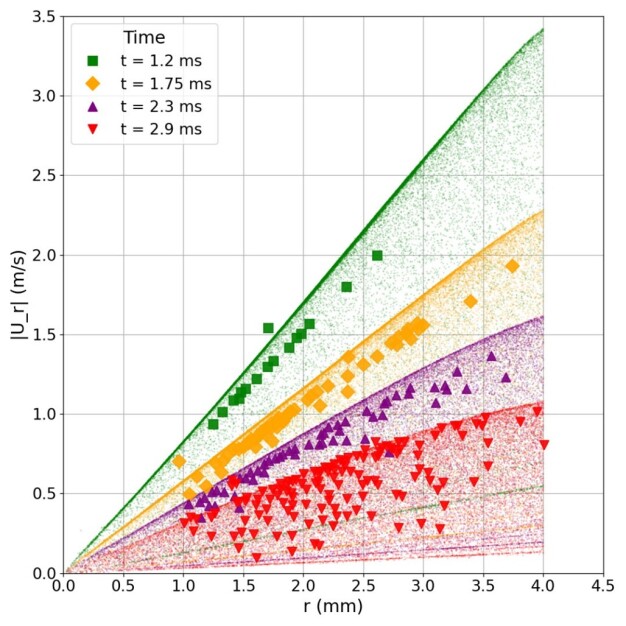
Figure 8: Comparison between experimental results obtained with μPTV and high-speed microscopic images and results obtained numerically with the VOF-LPT approach.
Overall, a good agreement is found between numerical and experimental results for the normal impact of water suspension droplets with small polystyrene particles. The droplet impact morphology and particle radial velocity profiles were successfully validated, showing that the VOF-LPT technique is robust in both fronts: the TCL modelling using a dynamic contact angle model and the tracking of point-particles considering relevant phenomena.
Conclusions
In this project, a CFD tool for the analysis of three-phase-flow phenomena was developed. Lagrangian point-particles are tracked within resolved VOF liquid droplets accounting for relevant droplet-substrate, particle-particle, particle-substrate, particle-interface, and particle-fluid momentum transfer in a 4-way coupled framework. Good agreement was found for the droplet impact morphology and particle dynamics when comparing the numerical results with experimentally obtained results.
This work is part of the project “Suspensionstropfen Wandkollision und Partikeldeposition”, funded by the German Research Foundation (DFG).
References
S. Schubert, J. Steigerwald, A. K. Geppert, B. Weigand, and G. Lamanna, “Micro-piv study on the influence of viscosity on the dynamics of droplet impact onto a thin film”, Experiments in Fluids 65, 1–23 (2024).
P. M. Vogelsang, T. Fuchs, and G. Lamanna, “Defocused shadowgraphy μPTV methodology for analyzing the spreading mechanism of an impacting droplet onto a thin liquid film”, in Proceedings if the 33rd ILASS Europe Meeting, (2025).
R. Tribess, P. M. Vogelsang, and M. Sommerfeld, “Experimental and numerical analysis of particle dynamics during suspension droplet impact process”, in Proceedings if the 33rd ILASS Europe Meeting, (2025).
R. Tribess, and M. Sommerfeld, “Numerical analysis of particle deposition during normal impact of diluted suspension droplets”, International Journal of Multiphase Flows, v. 194, 105452, (2026).