Calculation of an electrostatic precipitator
Promotion
-
Project title
Measurement and calculation of particle deposition in a test electric precipitator
Project leader
Prof. Dr.-Ing. habil. Martin Sommerfeld
Realized by
Dipl.-Phys. Carl-Uwe Böttner
Keywords
Filtration, air purification, numerics of turbulent two-phase-flow
Statement of the problem
Pollutant emissions through exhaust air are the most important type of environmental pollution in power generation. A significant part of these air pollutants consists of dusts and aerosols. Dust is generated in industrial plants (eg: cement factories) and, above all, in combustion processes, not only in the combustion of solid fuels. Today, more than 99% of the dusts are separated by filters in industry and in power stations. However, finest dust particles with diameters of a few mu-m pass through the filters to a large extent. In contrast to coarse dust, this fine dust can enter the lungs via the airways. The toxic effect is mainly due to the content of heavy metals, some of which promote cancer. In addition, other pollutants, such as hydrocarbons, sulfur or nitrogen compounds, are transported on the surface, which are thus transported into the lung.
An obvious approach is therefore to improve the separation efficiency of the otherwise satisfactory filter technology in the area of the finest dust. An electrostatic precipitator is usually used to clean large amounts of gas. The investigation of the processes in the electrostatic precipitator has not yet reached an exhaustive knowledge, although it was begun some time ago (1,2). As regards the current state, it is important to note that experimental and theoretical simplifications are often necessary.
Thus, the experimental plants are not on a technical scale (1), and in the case of the numerical computations significant influencing variables are neglected (3). Empirical approaches have also been in existence for some time, and the German equation (4) is most widely known, and are still used for interpretation, although it is known that inaccuracies have to be accepted (5). Because of the various scale dependencies of the forces acting, a transfer from the model to the large-scale plant is not possible or only possible to a limited extent.
Short description of the project
Therefore, a test facility was constructed which, with full optical accessibility, consists of a segment of a separator line with usual dimensions and operating parameters. Above all, the path width, the applied voltage and the area of the precipitation electrode are built in close resemblance to real life applications. Thus, on the one hand, a technically relevant operating state is achieved, and on the other hand it is possible to observe experimentally the influence of operating mechanisms such as the growth of the precipitation layer. However, the test facility is also used to yield comparison data for the numerical calculation. Special emphasis is placed on the underlying electrohydrodynamics. The influence on the particle flow and the degree of separation by the electrostatic field over the applied high voltage is examined experimentally and numerically in detail. The experimental measurements are first determined by the laser Doppler anemometer (LDA). In a next step, a flow measurement with Particle Image Velocimetry (PIV) is planned.
The variation of the parameters relates to the following operating conditions:
- Gas velocity: 0,5 m/s - 1,0 m/s - 2,0 m/s
- High voltage: 0 V - 20 KV - 40 KV - 60 KV
- Particle size distributions
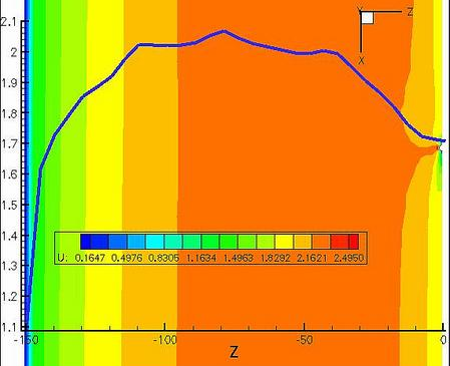
The numerical calculation is based on the finite-volume method. The two-phase flow is calculated by the Euler-Lagrange method. A distinction is made here between two differently treated phases: the disperse phase, which is strongly diluted in this assumption, consists of the fine dust particles, and the continuous phase in this case is the gas flow. The electric field force is also calculated by a finite-volume method and coupled to the gas flow. The following diagrams illustrate the procedure. First, the calculated field strength for 7 wires and in the next picture the color is under the color is the U-component of the gas velocity, above the tracks of traced particles are reproduced.
 |
 |
| Photo 1: Field strength for 7 wires | Photo 2: U-component of the gas velocity |
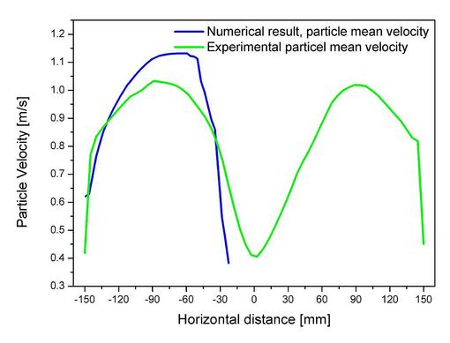
The comparison of measurement and modeling shows that both the gas flow and the particle flow represent well the actual trend, but the speeds are predicted somewhat too high.
 |
 |
| Photo 3: Diagram Particle speed | Photo 4: Diagram Gas flow |
Literature
-
Chang, C.-L., Bai, H.
"An Experimental Study on the Performance of a Single Discharge Wire-Plate Electrostatic Precipitator With Back Corona"
J. Aerosol Sci. Vol. 30, No. 3 (1999), pp. 325-340 -
Kercher, Hermann
"Elektrischer Wind, Rücksprühen und Staubwiderstand als Einflußgrößen im Elektrofilter"
Staub-Reinhaltung der Luft 29 (1969) Nr. 8 August -
Choi, B. S., Fletcher, C. A. J.
"Computation of particle transport in an electrostatic precipitator"
Journal of electrostatics, 40 & 41 (1997), 413-418 -
Deutsch, W.
"Bewegung und Ladung der Elekrtizitätsträger im Zylinderkondensator"
Annalen der Physik, 68 (1922), S. 335-344 -
Jones, J. E., Davies, M.
"A critique of the Deutsch assumption"
Journal of Physics D, 25 (1992), 1749-1759


